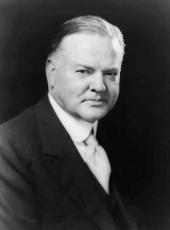
PRESIDENT HOOVER, to protect American workingmen from further competition for positions by new alien immigration during the existing conditions of employment, initiated action last September looking to a material reduction in the number of aliens entering this country. At his request, the Department of State examined the operation of the immigration law and reported that the only important provision of the law useful in the circumstances is that one requiring the exclusion of those who are liable to become public charges. Since then consular officials, charged with the duty of issuing visas to intending immigrants, have carefully examined each applicant. A tabulation completed today shows that during the first 5 months ending February 28, 1931, of the administration of the "likely to become a public charge" provision approximately 96,883 aliens did not receive visas who normally would have immigrated into this country.
Reports from American consuls assigned to 21 countries whose annual quotas total 148,466 of the total quota of 153,714 indicate that only 10,277 visas were issued during the 5-month period against a possible 74,233 allowable under law, or an under-issue of 86 percent.
Incomplete reports from the remaining 46 countries with annual quotas totalling 5,248 indicate an issue of 270 visas, a reduction of 90 percent.
Canada and Mexico furnished 70 and 19 percent, respectively, of the 61,504 nonquota visas reported issued during the fiscal year ended June 30, 1930, remaining 11 percent having been issued to natives of Central and South America.
During the 5-month period involved only 3,876 visas were issued to natives of Canada and 884 visas to natives of Mexico, as compared to 15,997 and 19,336 visas, respectively, in the corresponding 5 months of the last completed normal fiscal year, thus representing decreases of 76 and 95 percent.
Note: For the inauguration of the new immigration policy, see 1930 volume, Item 288.
Tables released with the statement follow:
TABLE I.--IMMIGRATION QUOTA VISA STATISTICS
OCTOBER 1930, TO FEBRUARY 1931, INCLUSIVE, COUNTRIES WITH QUOTAS OF 300 OR MORE
See legend and footnotes at end of table.
_______________________________________________________________________
Preference
Country 1 2 3 4 5 6 7 8 9 10
_______________________________________________________________________
|
Austria 706 17 14 27 32 90 13 87 05 95 |
TABLE I.-- IMMIGRATION QUOTA VISA STATISTICS -- Continued
See legend and footnotes at end of table.
_______________________________________________________________________
|
Country 1 2 3 4 5 6 7 8 9 10 Great Britain and Total 74, 233 2, 388 456 2, 850 4, 583 10, 277 14 86 07 93 |
Legend:
1: Half of annual quota 1
2: Relatives of American citizens
3. Farmers
4. Relatives of aliens
5. Nonpreference
6. Total quota visas reported issued
7. Percent issued 2
8. Percent under-issued 2
9. Percent nonpreference issued 3
10 Percent nonpreference under-issued 3
1 Only 10 percent of quotas which are 300 or over may be issued each month.
2 Percent of possible issue actually issued or under-issued.
3 The figures given under column 9 represent the percentage of nonpreference visas issued as compared to the 5 months possible issue after reduction of the preference cases listed under columns 2, 3, and 4. The figures under column 10 represent the corresponding under-issue of visas.
NOTE.--The above figures represent visas actually reported as issued under each quota. In some instances reports on other visas for which quota numbers have been allotted to distant consulates are received by the quota control officers too late for inclusion in reports to the Department of State. The figures given for visas issued are therefore in some cases provisional in character and are slightly less than the total obtained at a later date.
OCTOBER 1930, TO FEBRUARY 1931, INCLUSIVE, COUNTRIES WITH QUOTAS
OF LESS THAN 300 TOTALING 5,248 ANNUALLY 1
_______________________________________________________________________
Month Average Actual Numerical
monthly issue issue decrease
|
_______________________________________________________________________ |
October 524 101 423
November 525 41 484
December 525 34 491
January 525 55 470
February 525 39 486
Total 2, 624 270 2,354
|
_______________________________________________________________________ |
1 Includes 46 countries, most of which have quotas of 100 annually.
TABLE III.--NONQUOTA IMMIGRATION VISA STATISTICS REGARDING NATIVES OF CANADA
OCTOBER 1930, TO FEBRUARY 1931, INCLUSIVE, WITH COMPARISON OF SAME PERIOD LAST FISCAL YEAR
_______________________________________________________________________
5 months 5 months Numerical
ended ended decrease
Feb. 28, 1931 Feb. 28, 1930
|
_______________________________________________________________________ |
October 1,608 6, 117 4, 509
November 808 3, 770 2, 962
December 603 2, 109 1,506
January 483 2, 115 1, 632
February 374 1, 886 1, 512
Total 3, 876 15, 997 12, 121
|
_______________________________________________________________________ |
TABLE IV.--NONQUOTA IMMIGRATION VISA STATISTICS
REGARDING NATIVES OF MEXICO
OCTOBER 1930, TO FEBRUARY 1931, INCLUSIVE, WITH COMPARISON OF SAME PERIOD LAST FISCAL YEAR BEFORE THE PRESENT ADMINISTRATIVE MEASURES WERE PLACED IN OPERATION
5 months 5 months Numerical
ended ended decrease
Feb. 28, 1931 Feb. 28, 1930
|
_______________________________________________________________________ |
October 236 4,030 3,794
November 189 3,963 3,774
December 217 3,743 3,526
January 157 3,425 3,268
February 85 4,175 4,090
Total 884 19,336 18,452
Herbert Hoover, White House Statement on Government Policies To Reduce Immigration. Online by Gerhard Peters and John T. Woolley, The American Presidency Project https://www.presidency.ucsb.edu/node/211891

