

ICYMI: Council of Economic Advisers: New Data Show that Economic Growth Was Broadly Shared in 2021
Since President Biden entered office just over a year ago, the U.S. economy has seen strong growth. Over 2021, real gross domestic product (GDP) grew faster than it had in any year since 1984. The U.S. economy is now 3 percent larger than it was just before the pandemic, the fastest pandemic growth in the G7. However, in recent decades, this aggregate growth across the U.S. economy has not always been reflected equally across the income spectrum, as those at the top have benefitted more than the rest. A key question, then, is whether this year's strong economic growth has made its way to the typical American's pocketbook.
New data from a team at the University of California, Berkeley—Thomas Blanchet, Emmanuel Saez, and Gabriel Zucman—suggest the answer is a resounding yes. The researchers disaggregate the growth in national income to show how it is distributed across groups of individuals. To do this, they start with total national income from the national accounts data—a concept akin to GDP that measures the sum total of all the income accruing to those in the United States[1]—and then show who that income goes to.
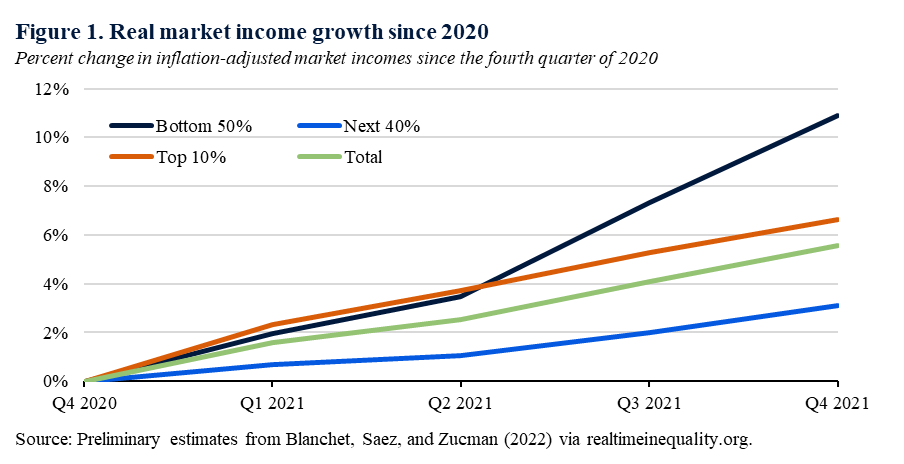
Their latest estimates show that the underlying economy is delivering gains to those in the bottom half of the income ladder, even before considering pandemic support. After adjusting for inflation, market income (labor and capital income before taxes and government benefits like Social Security, disability, and unemployment insurance) for adults increased across the income distribution in 2021. Relative to the fourth quarter of 2020, market incomes grew by 5.6 percent, on average. Growth was particularly strong in the bottom half of the income distribution, at 10.9 percent (Figure 1). This is consistent with published government data on employment growth, as 2021 saw the largest recorded one-year increase in jobs in U.S. history. Wage gains have been strongest for workers in the bottom quartile and fiscal support has benefited those in the bottom half of the income distribution, as described below.
These data are preliminary estimates using newly developed methods. Like much other economic data, they will be subject to revision as new information comes in. These data may also change as the methodology is refined over time. To present a complete picture of each income group's total income flows, these estimates require inferences based on the limited available data on wages, capital income, and government transfers. Nevertheless, these methods have been developed over many years, and have been published and debated in top academic journals.[2] The development of these innovative methods has been a careful undertaking, constituting a significant step forward in disaggregating income growth across the distribution. Importantly, they help us determine how household balance sheets have weathered the challenges of the pandemic economy of the past two years.
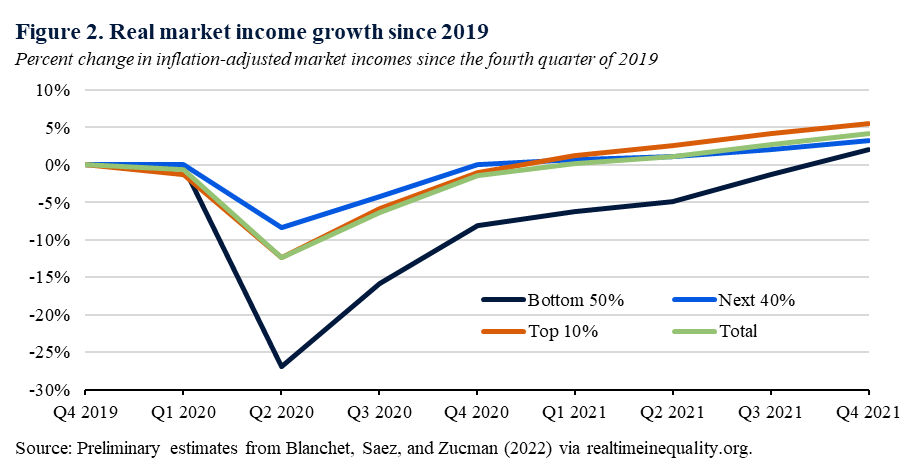
Going back another year in the data helps economists understand how Americans across the income distribution were affected by the pandemic, and the extent to which they have recovered today. Predictably, the data show that looking over the past two calendar years, market incomes plummeted in the second quarter of 2020, reflecting unprecedented job loss and eroded financial assets (Figure 2). The damage was broad across all incomes but particularly severe for Americans in the bottom half. Relative to the fourth quarter of 2019, market incomes for adults in the bottom half of the income distribution were more than 25 percent lower in the second quarter of 2020. But, these data show that they have since rebounded: market incomes exceeded pre-pandemic levels for the bottom 50 percent, next 40 percent, and top 10 percent of the income distribution in the fourth quarter of 2021 after adjusting for inflation. On average, they were over 4 percent higher.
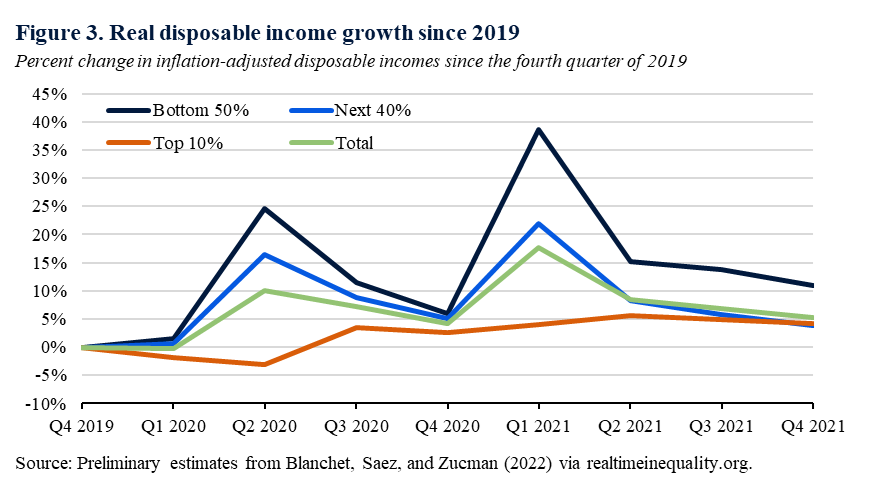
Market income is just one way to measure households' abilities to pay for essential goods and services. Blanchet, Saez, and Zucman also estimate disposable income—income after taxes and government cash and near-cash transfers (Figure 3). For most Americans, disposable income was higher throughout the pandemic than it was in 2019, even as market incomes took a severe hit. Pandemic legislation, including the American Rescue Plan, in combination with preexisting policies, such as unemployment insurance or other income support, protected the bottom 50 percent and the next 40 percent from income losses relative to the fourth quarter of 2019, on average.
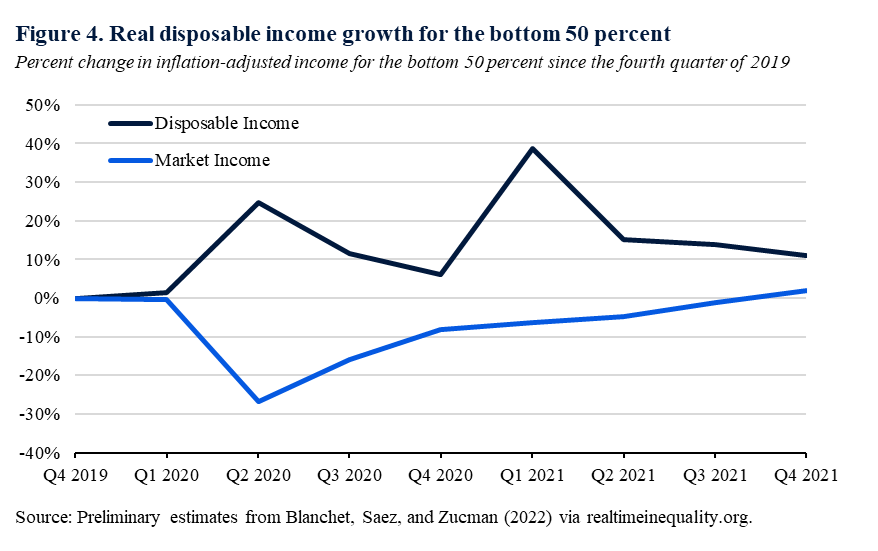
Zooming in on the bottom 50 percent illustrates this story clearly. The pandemic depressed market incomes, but public policies maintained disposable incomes throughout the pandemic while market incomes recovered (Figure 4). In the fourth quarter of 2021, market incomes for the bottom 50 percent were 2 percent higher on average than they were before the pandemic, and disposable incomes were 11 percent higher.
These data show that government support during the pandemic protected households, helping them manage the challenges of the pandemic, and positioning them today with higher levels of inflation-adjusted disposable income than before the pandemic. Other economic data also point to the benefits of the government's response. As noted in a recent CEA blog, over 2021, the economy added 6.7 million jobs, and the unemployment rate fell to 4 percent—years earlier than projected just before the American Rescue Plan passed. As a result of pandemic support and these economic gains, child poverty is likely to be reduced by almost 40 percent in 2021. As the President called for in his address to Congress last year, this is an economy that is growing from the middle out.
The data also point to remaining challenges: while all income groups experienced income growth in the past year, these gains were not evenly shared. Over 2021, as the economy grew sharply, those between the 50th and 90th percentile saw their market income grow more slowly than those in the bottom half or the top 10 percent. And, across the income spectrum, many Americans are not necessarily feeling better off according to various surveys. Although all these income groups saw their inflation-adjusted market income grow, it may be that many are concerned that these gains will be erased by inflation or a turnaround in economic progress. Updates to these data and ongoing efforts at the Bureau of Economic Analysis to produce official distributional estimates will be important. As the Administration continues to use every tool at its disposal to build an economy from the middle out, long-term investments, such as the Bipartisan Infrastructure Law, legislation to promote American competitiveness in manufacturing, and Build Back Better, can both increase economic growth and ensure that market incomes grow across the income spectrum.
[1] GDP measures the output of goods and services produced in the United States. National income, the measure used by Blanchet, Saez, and Zucman (2022), measures the "income from production that accrues to U.S. residents, regardless of where that productive activity is located" (BEA 2015). That is, national income is GDP minus capital depreciation, plus income from the rest of the world less income to the rest of the world.
[2] The debate includes this paper by Gerald Auten and David Splinter and Zucman et al.'s response.
Joseph R. Biden, Jr., ICYMI: Council of Economic Advisers: New Data Show that Economic Growth Was Broadly Shared in 2021 Online by Gerhard Peters and John T. Woolley, The American Presidency Project https://www.presidency.ucsb.edu/node/354606