
[Substantially revised as of 7/31/2024; employment and inflation graphs updated 9/6/2024; approval 11/01/2024; employment as of 10/4/2024; all graphs updated 12/6/2024.]
Bottom Line [copied from the Bottom Line below!]: As of the end of July 2024, assuming a Biden Gallup approval score of 40 percent and a continued rate of jobs growth between 1 and 2 percent, the model predicts a very narrow Democratic 2024 victory in the Electoral College (275 votes) and in the two-party vote share (50.1 percent). BUT: there is a lot of uncertainty about those predictions—this is basically a prediction of a tie. Updated note of November 1: At end of October, Gallup put Biden's approval at 41.0 percent. Real Clear Politics average of recent Biden approval polls is 40.6; for 538.com the aggregate is 38.4. All of these continue to be essentially the 40 percent number assumed in our July 2024 forecast. So, statistically the prediction is still for a tie.
There is great interest in foreseeing the outcome of the 2024 election. In light of this, the American Presidency Project presents instructive graphs comparing incumbent President Biden with prior incumbents both who won and who lost their bid for reelection.
Of course, there are no recent—or even distant—close analogies to the 2024 election. The last president to run for reelection as an incumbent, suffer a defeat, and then run for election again and win, was Grover Cleveland in 1892.[1] No president, having been impeached, was again a candidate for the presidency. No president, having left office, has been formally accused of crimes. No U.S. election has (prior to 7/21/2024) featured two such aged candidates of major parties. In fact, only fifteen of 46 presidents have outlived Donald Trump, the younger of the two (initial) major 2024 candidates.[2]
So, as the investment companies warn, “past performance does not guarantee future results.”
[Major 7/31/24 update:] As I noted in the first version of this essay, in early March 2024, the 2024 presidential election is unprecedented in many ways. During July 2024, things got even more remarkable. Incumbent President Biden, constitutionally eligible to be reelected, ended his run for the nomination. This happened after he had insisted for weeks that he planned to claim the nomination in August. See the table of events nearby. This leaves Donald Trump as the oldest major party candidate ever.
The GOP challenger, former President Trump, was superficially wounded in an assassination attempt only days before the GOP Convention. The last Presidential candidate to be an assassination target was Democrat George Wallace in 1972. Wallace was seriously wounded and paralyzed by that attack. In 1912, Progressive Party candidate and former President, Theodore Roosevelt was superficially wounded. Roosevelt went on immediately to give a speech.
By the end of July 2024, Biden was a lame-duck president, his physical health in question, but assured of absolute immunity for his official acts. At the time, Vice-President Kamala Harris had received the support of more than a majority of Democratic convention delegates. Her candidacy had been endorsed by just about every elected Democrat of any prominence.
| Remarkable Presidential Events of July 2024 |
|
Generating Forecasts
In the past, I have used variables like those in the graphs below to generate election forecasts primarily to stimulate classroom discussion. The models used are a variation of the “time for change” model developed by Alan Abramowitz.[3] More on this model below.
How do the events of July 2024 affect this election forecasting enterprise?
They have surprisingly little effect on the approach underlying the "time for change" model. The model makes a prediction for the party of the incumbent president—no matter whether the incumbent president is or is not a candidate. Truman dropped out in 1952 and LBJ in 1968 three to four months earlier than Biden in 2024. However, the model ignores that information and simply focuses on the fate of the incumbent’s party. Predicted outcomes are, as discussed further below, determined by the state of the economy and the incumbent President’s approval levels.
So, an important forecasting question continues to be whether Biden’s approval goes up. During July, during all this controversy and Biden’s public fumbling, his Gallup approval hit an all-time low. But in the next round of polling—later than would normally be used for making a forecast—I expect to see Biden’s approval numbers move upward. As of 7/31/24, the RealClearPolitics average of approval polls shows him above 40 percent, some polls put him as high as 46 percent.
For historical reference, Truman's approval ratings rose 10 percent between the date of his withdrawal and the 1952 election. In the 1968 election cycle, LBJ's approval rose about 8 percent.
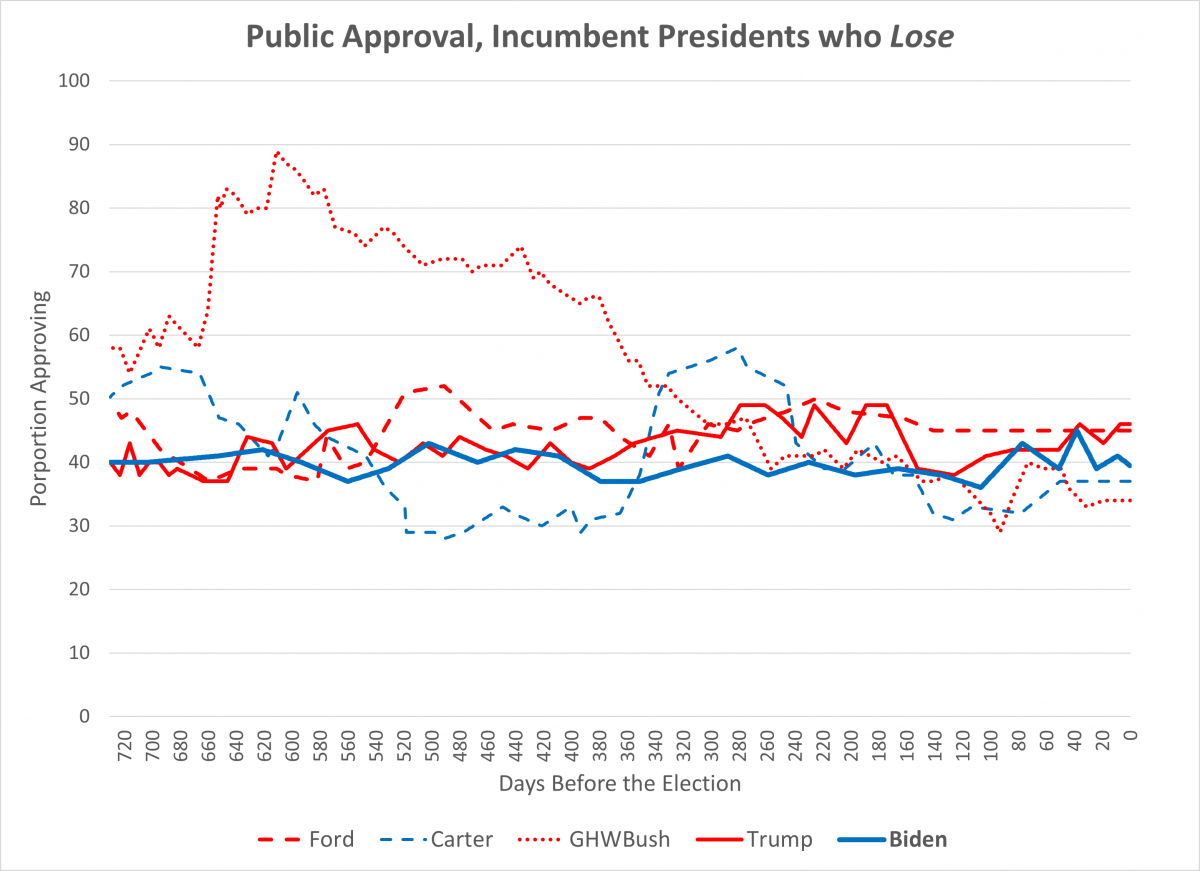
First Graph Pair: Gallup Approval
The first graphs compare the trends of presidential job approval in the two years prior to the election. The data plotted are the proportion “approving” of the incumbent on the well-known Gallup question: “Do you approve or disapprove of the way [name] is handling his job as president?” No other presidential evaluation question has been in use as long as Gallup’s.
In the winners graph we see that except for Truman, every winning president had greater than 50 percent job approval. Post-1956, approval of winning incumbents has been in a narrow range from 51 percent to 56 percent. In the 1948 data for Truman (with an approval of 40 percent), note that Gallup’s last poll was in late June of that year. So, any post-June 1948 movements of public opinion were not measured.[4]
Among the incumbent losers, all had public approval ratings below 50 percent. The highest approval for a loser was 46 percent (Trump).
For monitoring purposes, then, one will want to watch to see if Biden’s approval rate begins to trend upward just as Obama’s did in 2012. As of late-October, there have been positive moves, but there is still a large gap to reach 50 percent.
10/23/2024: These graphs still depict Biden's approval even though he is no longer a candidate. The model predicts a party's success based on the approval of the incumbent president (i.e., Biden) whether that individual is running again or not!! If there were a clear upward trend for Biden, that would be positive for Harris.
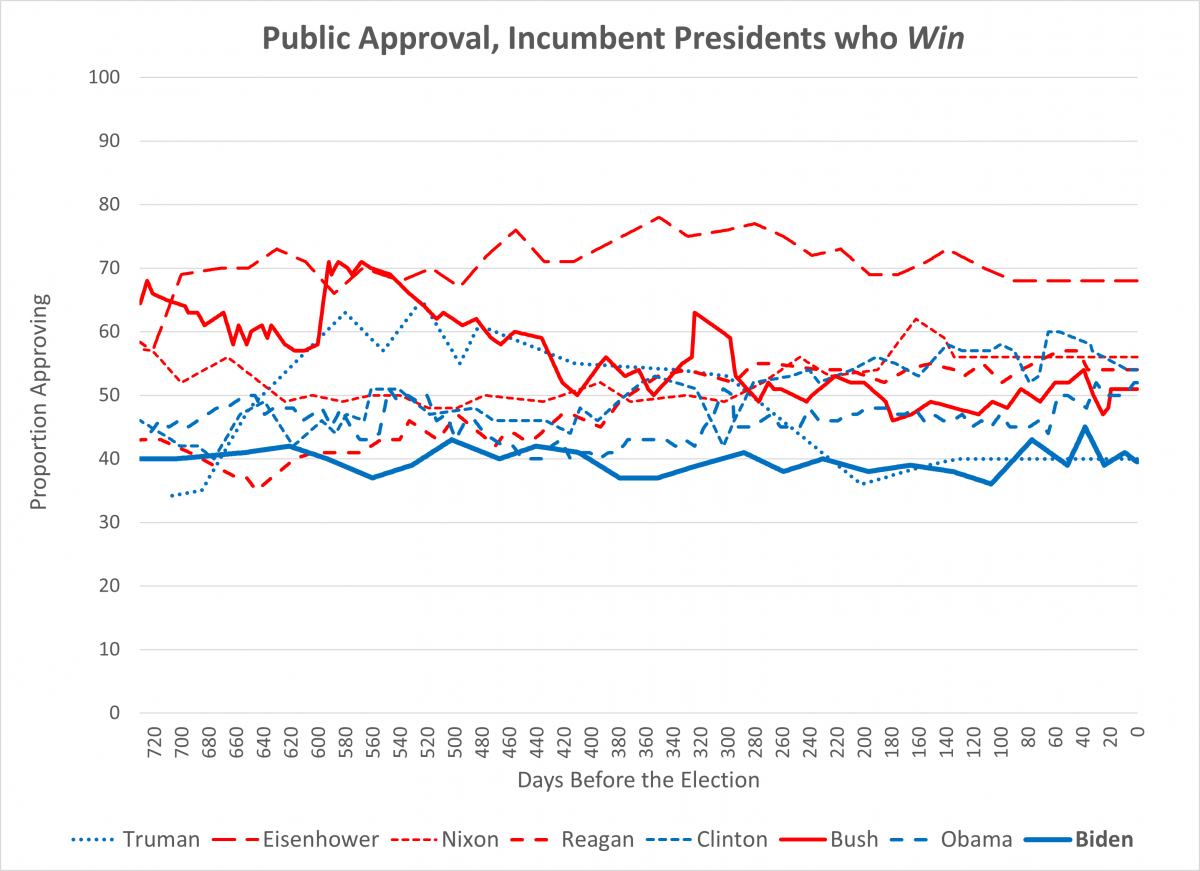
CLICK ON IMAGE TO SEE LARGER GRAPH
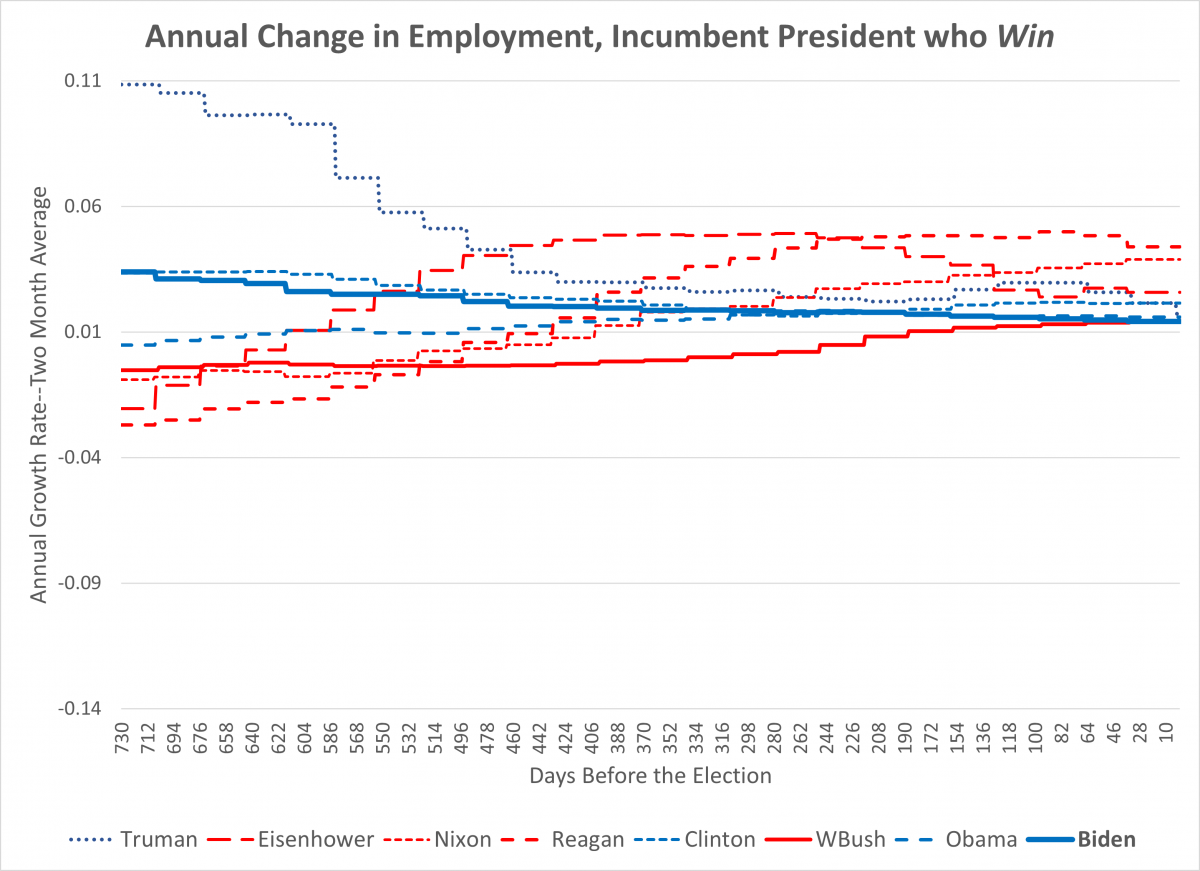
Second Graph Pair: Employment Growth
The second graphs display the annual growth rate of seasonally adjusted non-farm employment.[5] The change shown in these graphs ranges from strongly negative (-0.13) to strongly positive (+0.11). The statistical forecasting model, uses data from about 6 months prior to the election--or the 180 days point on the graph X-axis.
In the winners graph, the final election-day employment growth rates are all positive and above 1.5 percent. The range for winners is from around +0.0145 (or 1.45 percent) for George W. Bush to +0.043 (or 4.3 percent) for Reagan. Good economic numbers matter. Current numbers put Biden at about 0.018 (or 1.8 percent). That is, Biden's current numbers, if sustained, would leave him higher than both Obama and George W. Bush at election time.
In the losers graph the election-day range is from -0.063 (or -6.3 percent) for Trump to +0.032 (or +3.2 percent) for Ford. If Biden's current numbers are sustained, he will be well above Carter, George H. W. Bush, and Trump. In Trump's case, the data were profoundly affected by the effects of the COVID-19 pandemic on economic activity.
Ford, of course, is a special case. He is the only President not elected either to the Presidency or the Vice-Presidency. He succeeded the disgraced President Nixon in office, and his decision to pardon Nixon was very unpopular.

CLICK IMAGES FOR LARGER GRAPH IMAGE
What About Inflation???
There has been a great deal of discussion of inflation in 2024. However, inflation--measured by the Consumer Price Index--does not improve the quality of presidential election forecasts 1948-2020. The reason for this is suggested in the graphs below for incumbents running for reelection. For most winners, inflation has been low and steady, ending at the election day with rates between 2 and 4 percent (over the prior year).
For the losers, the variation has been dramatic in the two years leading up to the election. And the losing incumbents had inflation both higher and lower than average on election day. In 2024, Biden is approximately at the median for both winners and losers.
We've explored the notion that the variability in inflation is what matters, not the rate of change. But variability measures also do not improve the precision of the estimates.
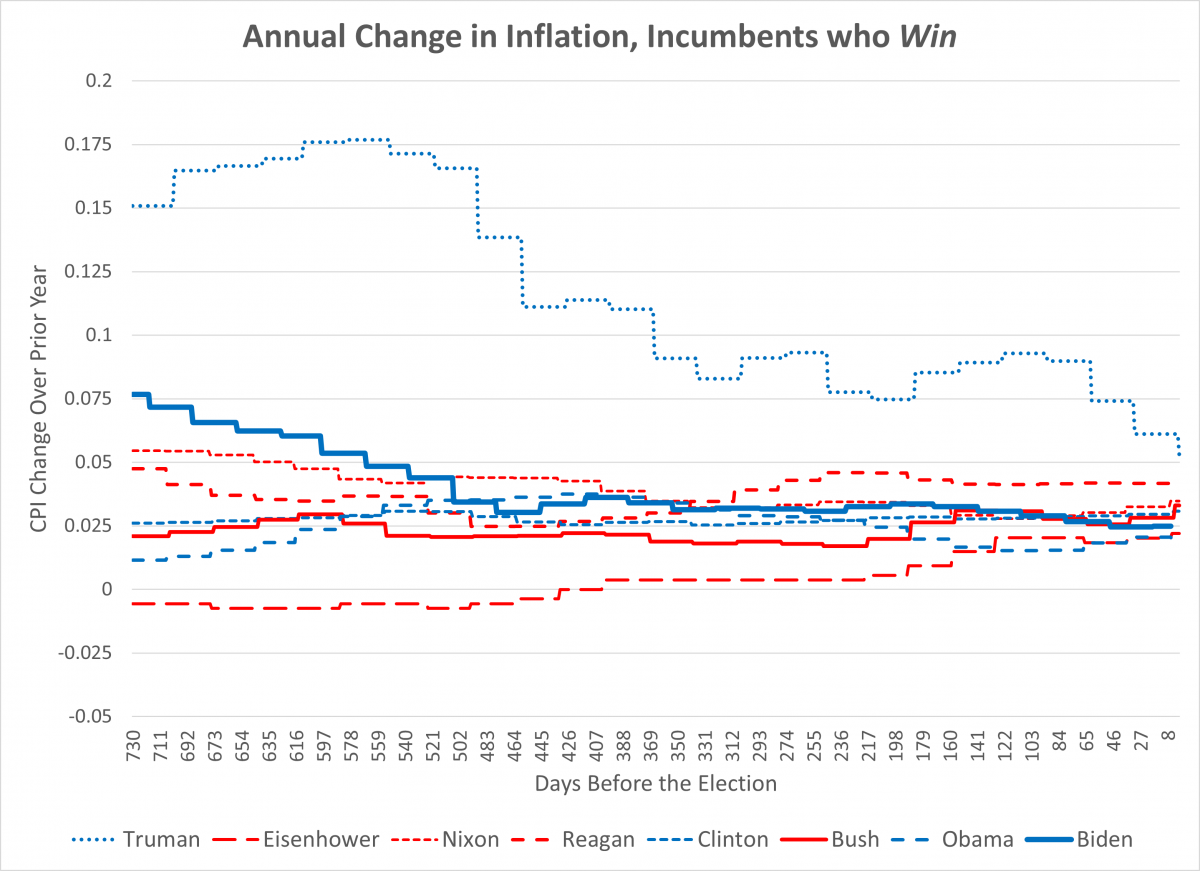
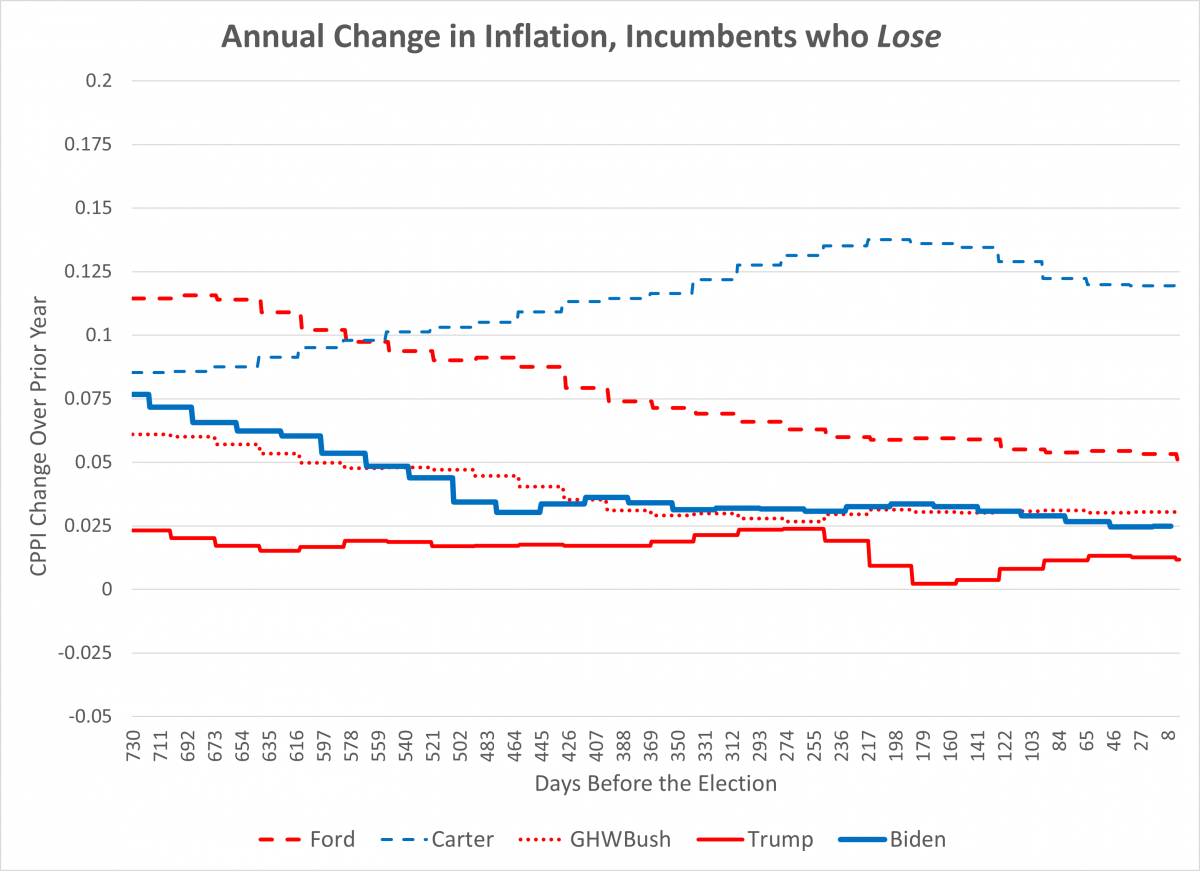
[these graphs updated 9/6/24]
Time for Change Model
The “time for change” idea is that a small, but significant, proportion of the electorate prefers to see a partisan change in the presidency after either major party holds the presidency for two consecutive terms. The implication of this (backed by strong statistical results) is that candidates like Hillary Clinton, Al Gore, and John McCain faced an additional election hurdle. To win, they would have to overcome this aversion to extended partisan domination. The 1988 election of George H. W. Bush shows that it is possible for the incumbent party to win a “time for change” election. In such a case, it may be helpful to face an inept opponent.
All that is Ignored
In the classroom, I use the statistical model to address this question: How can a model work if it ignores almost everything about the election contest that dominates the news? What about the issues? What about the qualities of the candidates and their campaigning? What about lies, smears, and dirty tricks?
Every candidate and campaign has weaknesses and strengths. There are issues that work both for and against them. Smart, well-run campaigns emphasize their strengths and the opposition’s weaknesses. They figure out what kinds of appeals connect with the marginal voters in swing states—which may be different from effective partisan appeals nationally.
Vigorous, smart campaigns tend to offset each other’s strengths and weaknesses. It’s the nature of a competitive process. So, when there is vigorous competition, the basic “fundamental” features dominate the outcomes: Do enough voters see the incumbent (party) as doing a good job? How good is the economy? Is it a time for change?
The model definitely does not mean that campaigns do not matter, or that candidate performance is irrelevant. Quite the contrary. Forecast errors often point to a candidate with vulnerabilities that cannot be overcome or diminished.
Remarkably enough, the statistical model works well for past elections!
[7/31/24 addition:] Prior Performance.
As reflected in the graphs below, the model fits the historical data fairly well, but is certainly not perfect.
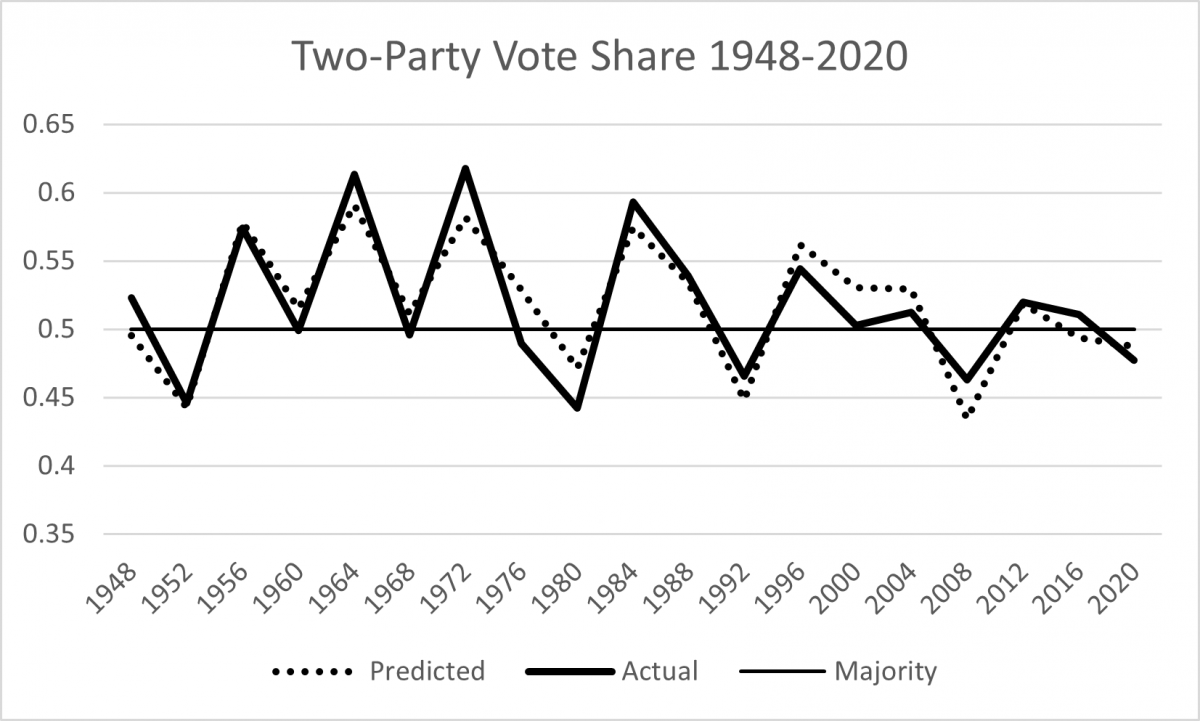
One model is for the incumbent party share of the “two-party popular vote.” That is the share of the vote won by the incumbent President’s party considering only Republicans and Democrats, ignoring minor party candidates. For the statistically minded, this model has an overall R-square of 0.82, and all of coefficients on the three predictor variables are strongly “significant.” The model incorrectly predicted incumbent party popular vote victory in 1960, 1968, and 1976, and popular vote defeats in 1948 and 2016. [see graph]
The other model is for the number of electoral college votes won by the party of the incumbent president. It takes 270 votes to win, of course, and this is what matters, not the popular vote. Here again the model tracks the historical record fairly well but, again “misses” several times: 1948, 1960, 1968, 1976, 2000. Again, in statistical terms the model is pretty good (with an R-square of 0.78). The coefficients on the three predictor variables are strongly significant. [see graph]
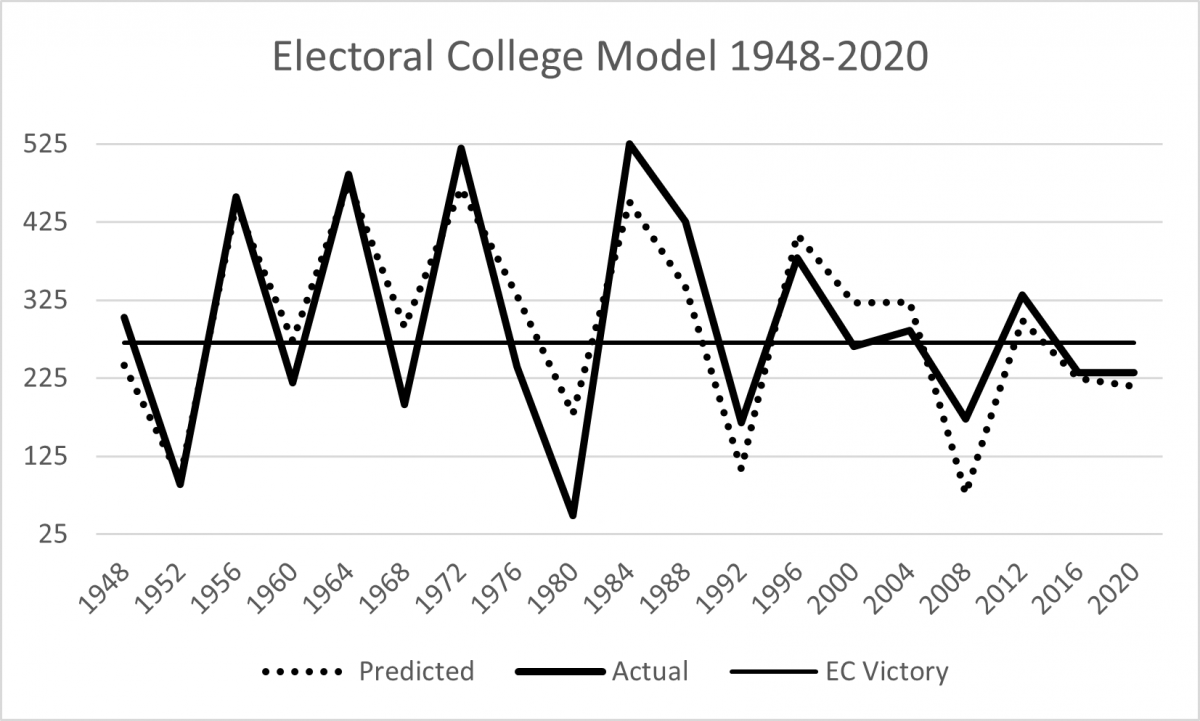
So, to take two recent cases, the model correctly predicted Hillary Clinton’s electoral college loss in 2016. And, in 2020, the model predicted Donald Trump’s loss in both the popular vote and the electoral college.
Bottom Line: As of the end of July 2024, assuming a Biden Gallup approval score of 40 percent and a continued rate of jobs growth between 1 and 2 percent, the model predicts a very narrow Democratic 2024 victory in the Electoral College (275 votes) and in the two-party vote share (50.1 percent). BUT: there is a lot of uncertainty about those predictions—this is basically a prediction of a tie. Updated note of October 23: At the middle of October, Gallup put Biden's approval back at 39 percent, down from the prior 45 percent--the highest measured since August 2021. Real Clear Politics average of recent Biden approval polls is basically steady at 41.1; for 538.com the aggregate is also generally steady at 39.7. All of these are mildly positive for a Democratic victory, but statistically the prediction is still for a tie.
[Revision Note: The version of this analysis originally published on March 2, 2024 erroneously included data for Biden that were from earlier in his term. Those data have been corrected; graphs updated; related text corrected.]
[1] Cleveland defeated incumbent Republican Benjamin Harrison, but a third-party candidate for the Populist party won more than enough votes to have shifted the election to Harrison.
[2] Presidents living longer than Trump: Jimmy Carter, George H. W. Bush, Gerald Ford, Ronald Reagan, John Adams, Herbert Hoover, Harry S Truman, James Madison, Thomas Jefferson, Richard Nixon, Joe Biden, John Quincy Adams, Martin Van Buren, Dwight Eisenhower, and Andrew Jackson.
[3] Beginning with “The Time for Change Model and the 2000 Election” American Politics Quarterly 29: 279-282.
[4]Over the years, Gallup observations have been made at irregular frequencies. These data report the result associated with the final date in the polling sequence. The graphs link the poll data observations by moving average interpolation, generating a straight line between the two polling observations.